Contents
1 Team Progress Block
2 Overview
3 Scope
4 User Flow
5 Functional Data Definitions
6 Important Calculation Logic
7 Graphical Representation
8 Functional Validation
9 Role-Based Access Validation
10 Data Accuracy Validation
11 Expected System Behavior
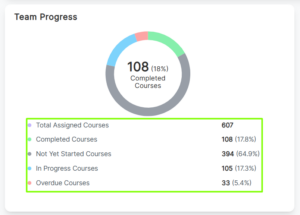
Team Progress Block
The Team Progress Block provides Managers with a consolidated and visual overview of their team’s course progress.
Overview
This feature enables Managers to:
- Monitor overall course distribution
- Track completion percentages
- Identify pending and overdue courses
- Take proactive action based on performance trends
- View progress in both numerical and graphical formats
Scope
The Team Progress Block includes:
- Aggregated course data for Manager’s team
- Calculation and display of course percentages
- Separate visibility of overdue courses
- Doughnut chart graphical representation
- Mouse hover interaction for detailed data
- Real-time data calculation
User Flow
Manager Flow:
- Login as Manager who has users assigned
- Navigate to Dashboard → Team Progress Block
- View summarized course metrics:
- Total Assigned Courses
- Completed Courses
- Not Yet Started Courses
- In Progress Courses
- Overdue Courses
- View percentage values displayed beside each metric
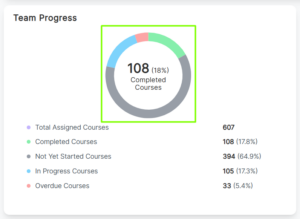
- Observe graphical representation in doughnut chart format
- Hover over chart segments to view detailed count and percentage
Functional Data Definitions
Total Assigned Courses
- Displays total number of courses assigned to all team members
- Formula: Completed + Not Yet Started + In Progress
Completed Courses
- Total completed courses
- Percentage: (Completed / Total Assigned) × 100
Not Yet Started Courses
- Courses not started
- Percentage: (Not Started / Total Assigned) × 100
In Progress Courses
- Courses started but not completed
- Percentage: (In Progress / Total Assigned) × 100
Overdue Courses
- Courses not started or in progress AND past due date
- Percentage: (Overdue / Total Assigned) × 100
Important Calculation Logic
- Total Assigned includes Completed, Not Started, and In Progress
- Overdue courses are not a separate category
- Overdue is part of Not Started or In Progress
- Displayed separately only for tracking
- All percentages use Total Assigned as denominator
Graphical Representation
- Displayed as Doughnut Chart
- Each category has a distinct color
- On hover:
- Category name
- Course count
- Percentage
- Chart must match numerical data
Functional Validation
- Login as Manager
- Navigate to Team Progress Block
- Verify all course metrics
- Verify percentage values
- Validate chart representation
- Check hover details
Role-Based Access Validation
- Manager can access Team Progress Block
Data Accuracy Validation
- Assign courses to users
- Mark some as Completed
- Keep some Not Started
- Start some courses
- Set some courses as overdue
- Verify data reflects correctly
- Manually validate percentage calculation
Expected System Behavior
- Data loads dynamically
- Calculations are accurate
- Percentages update in real-time
- Overdue logic does not duplicate counts
- Graphical data matches numeric data
- Only Managers have access