
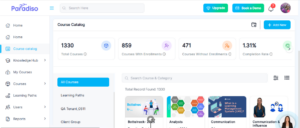
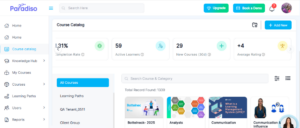
1. Course catalog statistics menues as admin:
- We’ve enhanced the Course Catalog statistics for Admin users to provide deeper insights into course performance.
- The statistics menu now displays the following metrics:
- Total Courses – Total number of courses created
- Courses with Enrollments – Courses with at least one enrolled user
- Courses without Enrollments – Courses with no enrolled users
- Completion Rate – Percentage of users who have completed their courses
- Active Learners – Users who have accessed a course within the last 30 days
- New Courses (30d) – Courses created in the last 30 days
- Average Rating – Average user rating for completed courses
- These enhancements provide better visibility into course engagement and performance.
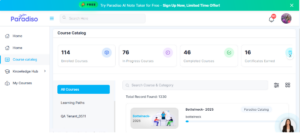
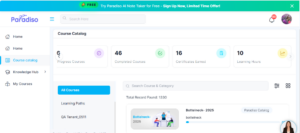
2. Course catalog statistics menues as user:
- We’ve improved Course Catalog statistics for users to better reflect their learning progress.
The statistics menu now displays:- Enrolled Courses – Number of courses the user is enrolled in
- In Progress Courses – Courses currently in progress
- Completed Courses – Courses successfully completed
- Certificates Earned – Certificates achieved from completed courses
- Learning Hours – Total time spent learning
- These updates help users track their learning journey more effectively.
3. Maya chatbot embedded:
- We’ve enhanced the embedded Maya chatbot experience for improved usability and interaction.
- Chatbot now closes when the user clicks outside the chat window.
- Proper spacing added between “Audio” and “Full Screen” icons.
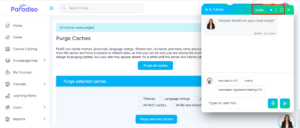
- Updated icebreaker video and type are displayed correctly in Embedded mode.
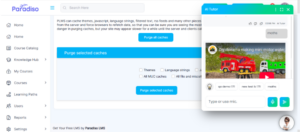
- All configured icebreakers for the page are now visible when the chatbot is opened.
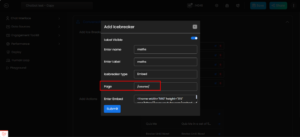
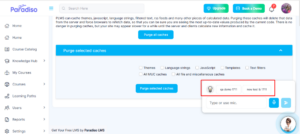
- Full chat history can be accessed using the upward arrow icon.
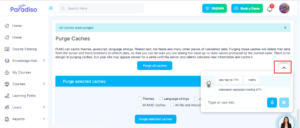
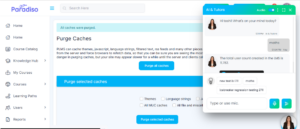
- These improvements enhance chatbot usability and interaction clarity.
4. Maya Teams Bot Integration:
- We’ve introduced integration of the Maya chatbot with Microsoft Teams to extend LMS accessibility.
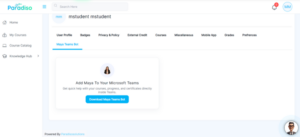
- Admins can access the integration via Integration → Productivity Tools, while students can access it from Profile → Maya Teams Bot.
- Users can:
- Open the bot in Microsoft Teams.
- Download the bot.
- Upon selecting Open in Microsoft Teams:
- Users can add the Maya bot (EVA).
- Sign in with their Microsoft account.
- Complete authentication.
- Once integrated, the LMS account is connected, allowing users to interact with Maya and get LMS-related responses directly within Teams.
- Admin Side –
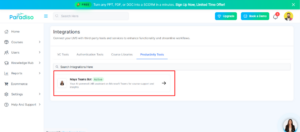
- Student Side –
5. Upgrade Pages Added:
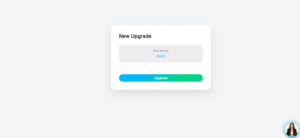
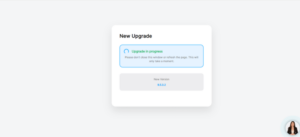
- Upgrade pages have been introduced for existing users.
- When users click the Upgrade button, their respective client instance is upgraded accordingly.
6. Onboarding Checklist – UI Enhancements:
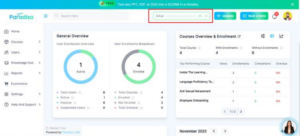
- We’ve improved the onboarding progress logic for better accuracy.
- Previously, progress was incorrectly displayed as 20% by default.
- This has been corrected to start at 0%.
- Progress now increases to 20% only after completing key steps such as:
- Updating logo.
- Updating branding colors.
7. Mixpanel Integration – Staging:
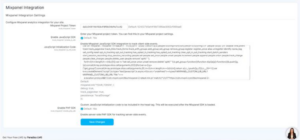
- We’ve integrated Mixpanel into the LMS to enable advanced analytics and user tracking.
- This allows tracking of user activities such as page visits and engagement data.
- Configuration is available under:
- Master Settings → Plugins.
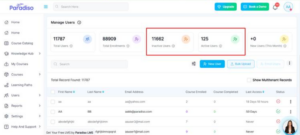
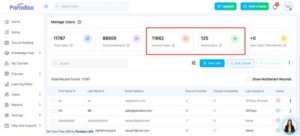
8. Manage Users – Tooltip Update:
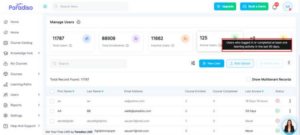
- We’ve improved tooltip clarity in the Manage Users section.
- Inactive Users – Includes suspended users and users who have not logged in within the last 90 days.
- Active Users – Includes users who have logged in or completed at least one learning activity within the last 90 days.
- This provides better clarity on user status.
9. Translation – Language Selection on Login Page:
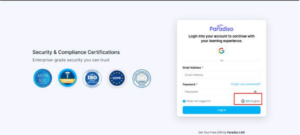
- We’ve added multilingual support to improve accessibility across the platform.
- 24 languages are now available.
- Language selection is accessible from:
- Login Page.
- Profile Dropdown.
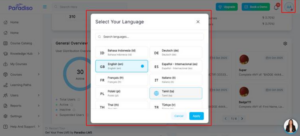
- The selected language is applied across the system, ensuring a consistent multilingual experience
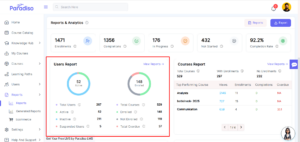
10. Users Report Block Added on Report Dashboard:
- A new Users Report Block has been added to the Report Dashboard, providing both graphical and numerical insights.
- Visual chart includes:
- Active Users
- Inactive Users
- Suspended Users
- Enrolled Users
- Not Enrolled Users
- Total Overdue Users
- Numerical metrics include:
- User Metrics:
- Total Users
- Active Users
- Inactive Users
- Suspended Users
- Course Enrollment Metrics:
- Total Courses
- Enrolled Users
- Not Enrolled Users
- Total Overdue
- This feature improves visibility into user activity and engagement.
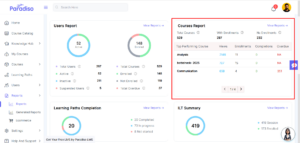
11. Courses Report Block Added on Report Dashboard:
- A new Courses Report Block has been added to the Report Dashboard to provide course-related insights.
- Displayed metrics include:
- Total courses.
- Courses with enrollment.
- Courses without enrollment.
- Top-performing courses are highlighted based on:
- Views
- Enrollments
- Completions
- Overdue counts
- This helps identify high-performing courses and trends.
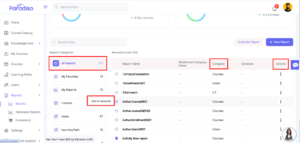
12. Report Table UI Updated:
- We’ve updated the Report Table UI for improved clarity and usability.
- Removed grey circular background behind numbers.
- Updated icon background color to #F3F8FE.
- Reduced width of highlighted sections.
- Added (+) icon to the New Report button.
- Moved All Reports category to the top.
- Added hover behavior and tooltips for Favorites.
- Updated report table column names.
- These updates enhance readability and overall user experience.
Summary:
- Focuses on improving system insights, reporting, and user interaction through enhanced analytics and UI improvements.
- Enhanced Course Catalog statistics for both Admins and Users.
- Improved Maya chatbot functionality and introduced Microsoft Teams integration.
- Added new reporting capabilities with Users and Courses report blocks.
- Introduced multilingual support and Mixpanel integration for better analytics and accessibility.
- Refined UI/UX across onboarding, reports, and dashboards for improved usability.