Contents
1 Description
2 Overview
2.1 Attempt Summary/Last Attempt Summary
2.2 My Progress and Predictions – It shows three types of graph.
2.2.1 For Multiple attempts it shows:
2.2.2 Hardest Question
2.2.3
2.3 Question Categories’ Analysis
2.3.1 Question Per Category
2.3.2 Challenging Categories (Across All Users)
2.3.3 Challenging Categories for me
2.4 Scores’ & Questions’ Stats
2.4.1 Scores by Percentage (All Users)
2.4.2 Question Analysis
3 Setting Instructions
Description
This plugin provides users with the most important part of an exam/quiz, i.e, analytics. Every attempt each user makes on a quiz is scrutinized relevant data are portrayed via visually appealing graphs.
Overview
The gradebook interface for all Users, showing graphical analysis of their Quiz attempts for a course.
Go to any course page which has at least one Quiz, choose the “Quiz Analytics” after clicking on “Grades” link in the course tree of “NAVIGATION” block. Then we can see Quiz-name, the No of attempts of logged in user it appears as a table format. A”View Analytics” link is present there which upon clicking will display the graphical depiction.
In the graphical analysis it has four types of graphs:
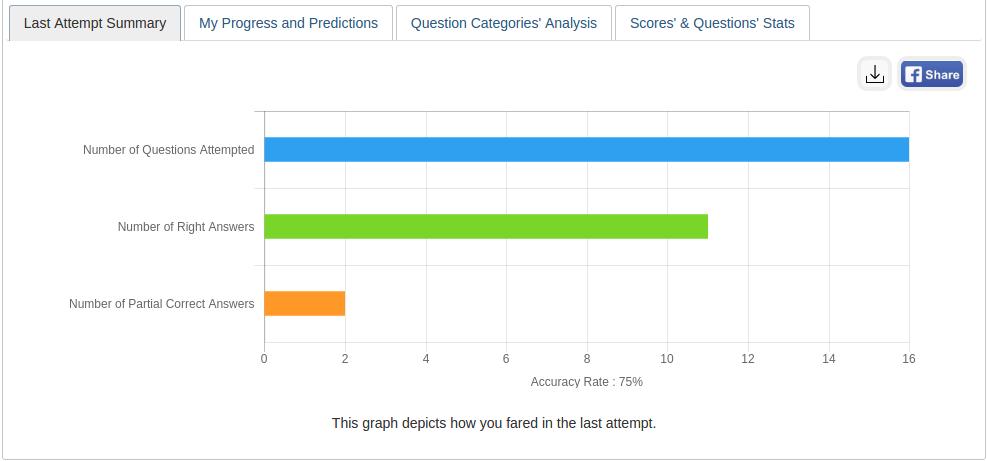
Attempt Summary/Last Attempt Summary
Attempt Summary for a single attempt and Last Attempt Summary for multiple attempts. It shows Number of Question Attempted, Right Answer, Partially Correct answers in the last attempt
and also shows the Accuracy Rate.
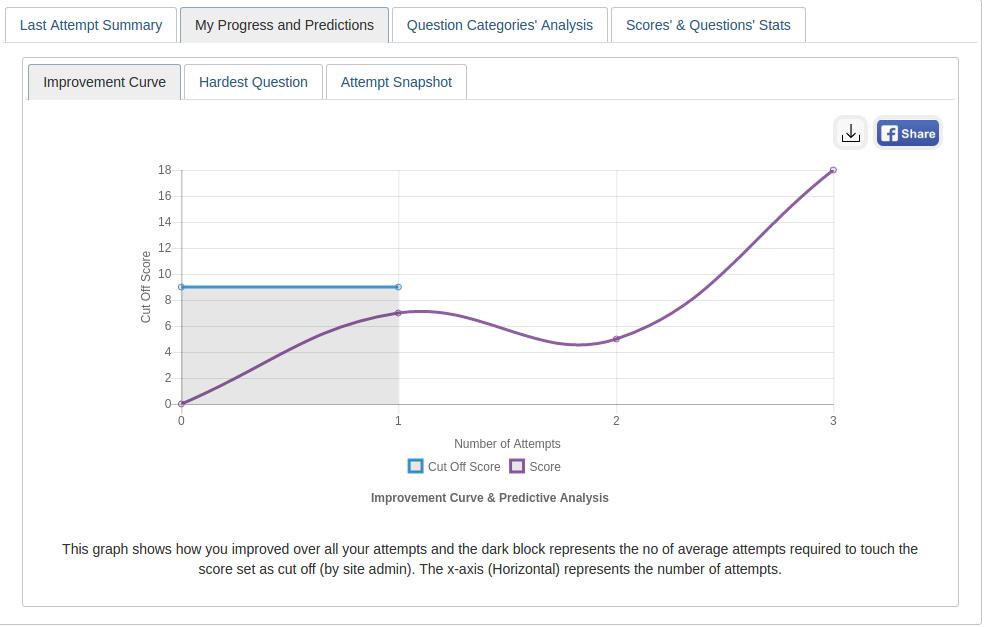
My Progress and Predictions – It shows three types of graph.
For Multiple attempts it shows:
Improvement Curve – This graph shows how you improved overall your attempts and the dark block represents the no of average attempts required to reach the score set as cut off (by site admin).
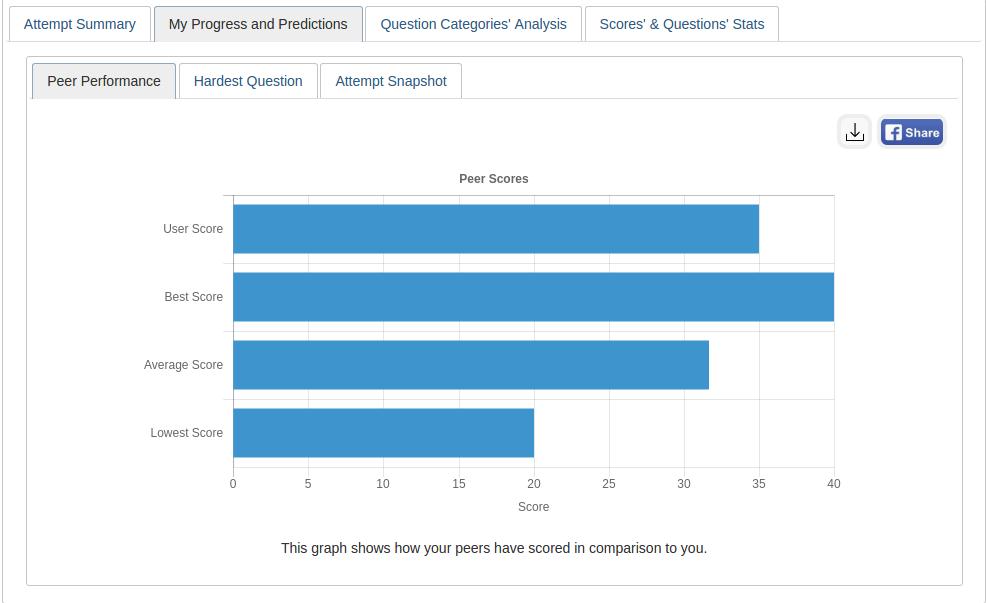
For Single attempt (Attempts allowed of that quiz is one) it shows:
Peer Performance – This graph shows how your peers have scored in comparison with you.
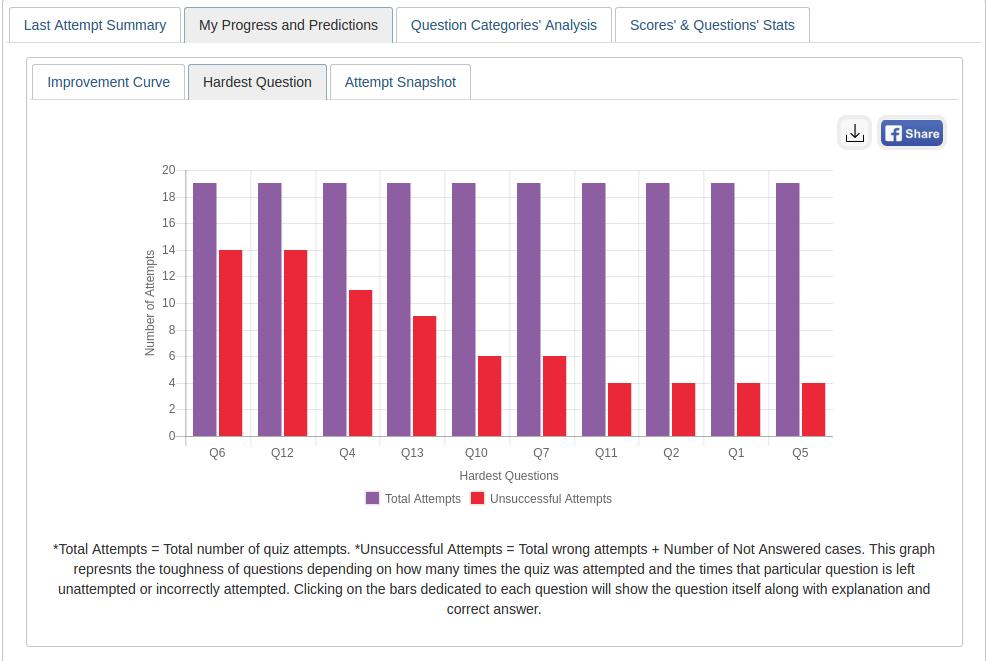
Hardest Question
This graph represents the top ten hardest questions depending on how
many times the quiz was attempted and the times that particular question is left unattempted or incorrectly attempted. Clicking on the bars dedicated to each question will show the question itself along with the explanation and correct answer.
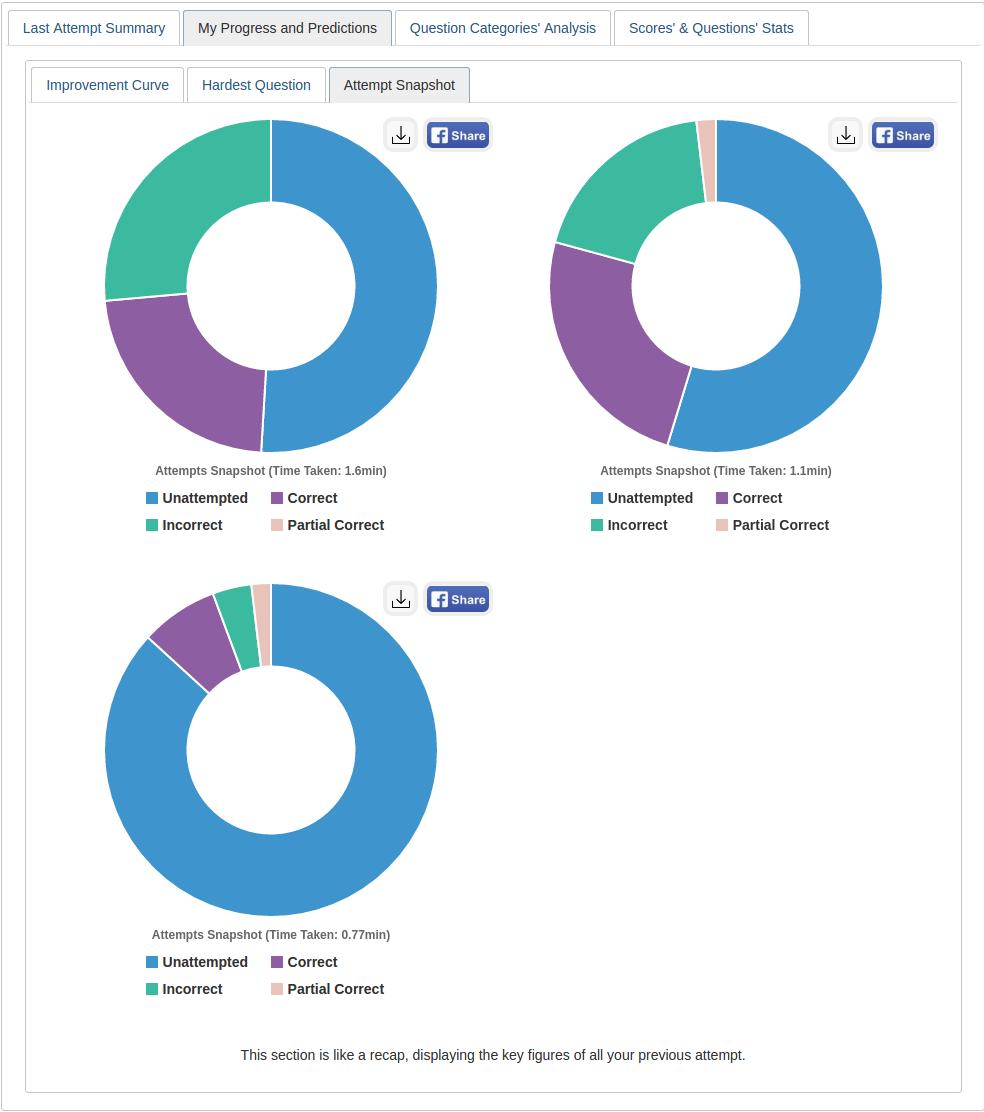
Attempt Snapshot
This section is like a recap, displaying the key figures of all your previous attempt.
Question Categories’ Analysis
It shows three types of graph:
Question Per Category
This graph tells you the number of questions present in the
quiz from each category.
Challenging Categories (Across All Users)
This section reports on the basis of wrong and not answered cases, the top ten categories that turned out to be most challenging across all the users who took the quiz.
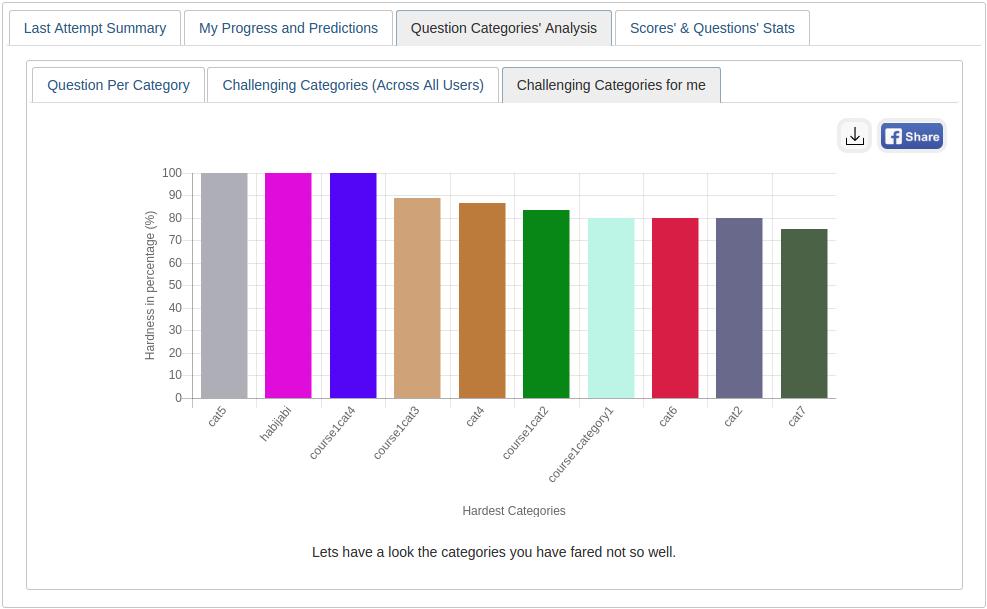
Challenging Categories for me
This graph shows the top ten categories that turned out to be the most challenging for the logged-in user.
Scores’ & Questions’ Stats
It shows two types of graph.
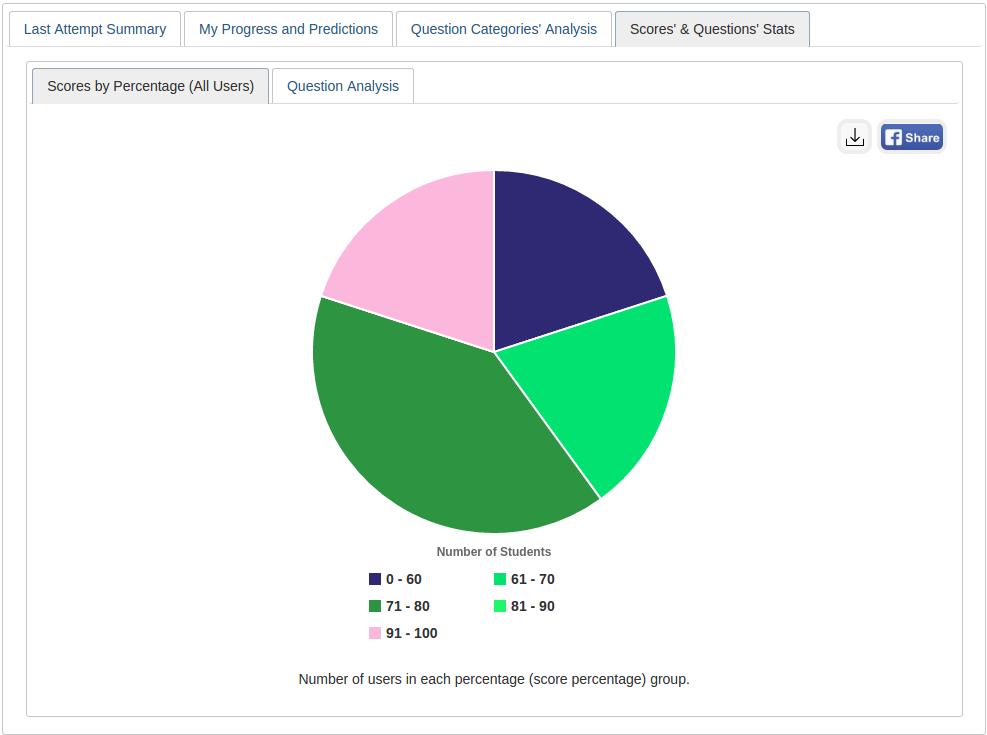
Scores by Percentage (All Users)
It shows Number of users in each percentage(score percentage) group.
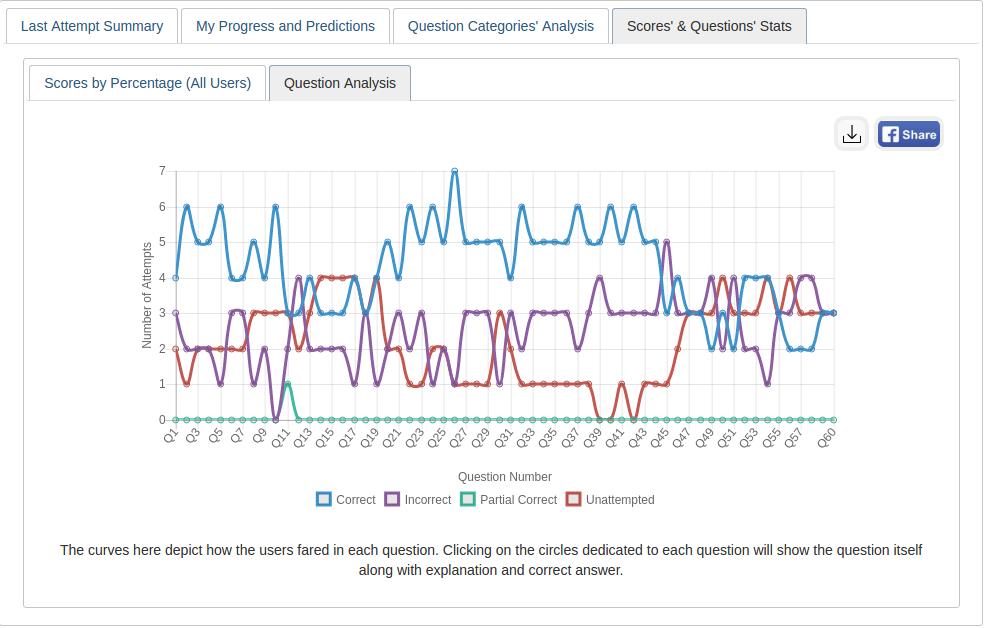
Question Analysis
The curves here depict how the users fared in each question.
Clicking on the circles dedicated to each question will show the question itself along with the explanation and correct answer.
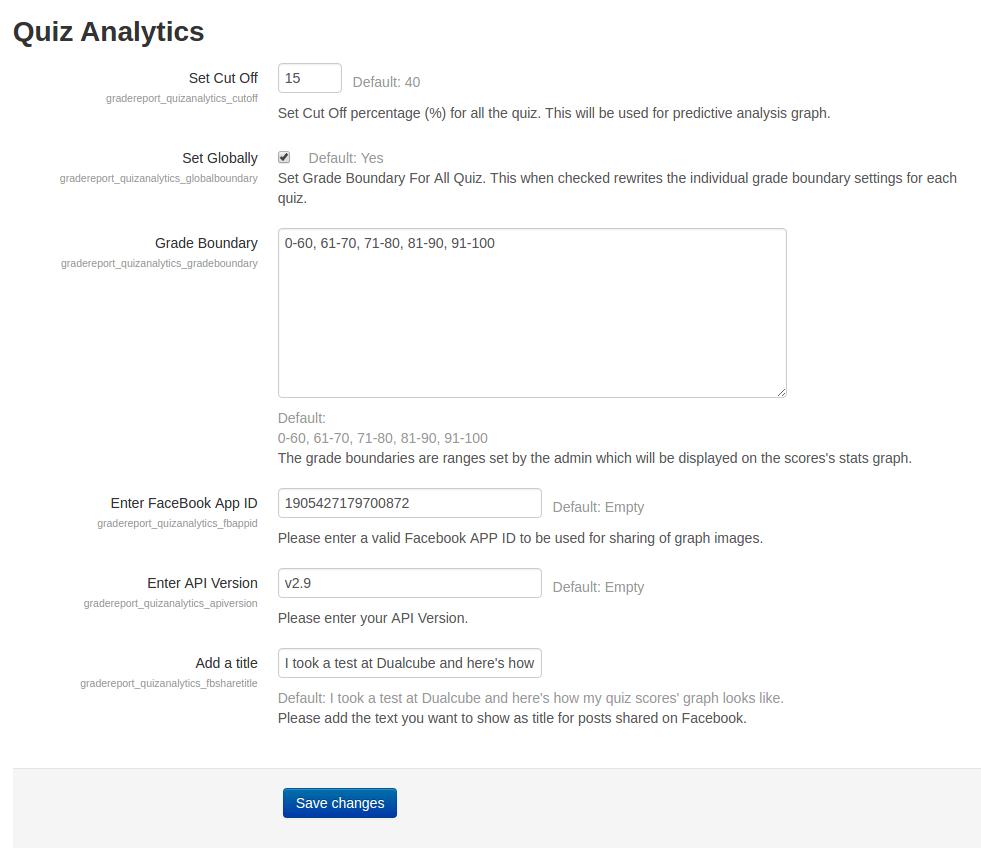
Setting Instructions
Go to Site administration -> Grades -> Report settings -> Quiz Analytics.
Here you can Set Cut Off for all the quizzes of the course, can set Grade Boundary and add Facebook App ID, Facebook API version and Title to share the graph on Facebook.
To Create a Facebook App ID:
- Login to Facebook.
- Click on Manage Apps from the left sidebar.
- Add an App by clicking on the “Add a New App” button. You can see API Version, App ID in the Dashboard page.
- Click on Settings link from left sidebar then fill up all the required fields and add one platform by clicking on the “Add Platform” choose “Website” After that click on the “Save Changes” button.
- Click on App Review from the left sidebar, click on the space to the left side of “No” to make your app public.